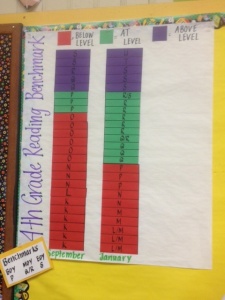
Although our students are well aware of their reading levels, they frequently lose sight of the growth they have made from the beginning of the year to the middle and end of the year. We created this chart as a visual reminder of the progress that our students have made and will continue to make this year.
As a class we noticed that many students who were reading below grade level at the beginning of the year are now reading at grade level. We were very encouraged by those students who worked hard to make that growth happen. 
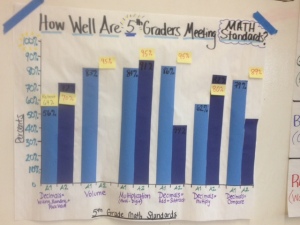
Another way that we share data with students is through sharing information about student performance by standard. Our students take 4 interim assessments throughout the year that assess their performance on various grade level standards. The data reports that we receive are very detailed and useful for our planning as teachers. We used the data to create this student-friendly display. The light blue bars depict how students performed on the first interim assessment. The sticky notes are the goals that students set for themselves for the second assessment. The dark blue bars show actual student performance on the second interim assessment. Students reflected on this data in class and will set goals for upcoming assessments.
